因为docker产生的容器不是一个永久存储的文件,所以无法保证你的文件永久保存。建议大家把容器产生的日志通过fluentd,flume,logstash等工具传送到一个日志仓库,这样保证方便保证数据的安全和管理。由于官方的推荐,我们本次讲解是fluentd日志收集组件。
具体使用如下:

安装ES
1. 初始化环境
[root@salt-node1 src]# vim /etc/sysctl.conf
vm.max_map_count = 290000

[root@salt-node1 src]#vim/etc/security/limits.conf
*        hard  nproc           20000
*        soft  nproc           20000
*        soft  nofile          290000
*        hard  nofile          290000

[root@salt-node1 src]# cat /etc/security/limits.d/20-nproc.conf
# Default limit for number of user\\'s processes to prevent
# accidental fork bombs.
# See rhbz #432903 for reasoning.

*          soft    nproc    290000
root       soft   nproc     unlimited

[root@salt-node1 src]# sysctl -p
net.ipv4.ip_forward = 1
vm.max_map_count = 290000
[root@salt-node1 src]# su - java
Last login: Sat Mar 18 00:40:54 CST 2017 on pts/1

查看参数是否生效
[java@salt-node1 ~]$ ulimit -n
290000
2.下载elasticsearch安装包并安装
[root@salt-node1 src]# wget https://artifacts.elastic.co/downloads/elasticsearch/elasticsearch-5.2.2.tar.gz
[root@salt-node1 src]# tar zxf elasticsearch-5.2.2.tar.gz && mv elasticsearch-5.2.2 /usr/local/elasticsearch
cluster.name: docker_log
network.host: 0.0.0.0
[root@salt-node1 local]# useradd java
[root@salt-node1 local]# chown -R java:java elasticsearch
[java@salt-node1 ~]$ nohup  /usr/local/elasticsearch/bin/elasticsearch &
[java@salt-node1 elasticsearch]$ curl localhost:9200
{
  "name" : "t3_jC3D",
  "cluster_name" : "elasticsearch",
  "cluster_uuid" : "ylQzD_hERziK29YF6O5bYg",
  "version" : {
    "number" : "5.2.2",
    "build_hash" : "f9d9b74",
    "build_date" : "2017-02-24T17:26:45.835Z",
    "build_snapshot" : false,
    "lucene_version" : "6.4.1"
  },
  "tagline" : "You Know, for Search"
}
安装fluentd
下载安装下面是监听本机24224端口收到日志,转发到192.168.199.116节点的ES上,索引名为docker_YYYY_mm
rpm -ivh http://packages.treasuredata.com.s3.amazonaws.com/2/redhat/7/x86_64/td-agent-2.1.3-0.x86_64.rpm

[root@salt-node1 elasticsearch]# chown 777 /var/log/messages
[root@salt-node1 elasticsearch]# cat /etc/td-agent/td-agent.conf

  type forward
  bind 0.0.0.0
  port 24224
  linger_timeout 0
  log_level info


#下面的filter会把所有标签为docker开头的日志里面的log字段进行单独解析,且这些日志的格式都为json

  @type parser
  format json
  key_name log

  type elasticsearch
  host 192.168.198.116
  port 9200
  logstash_format true
  logstash_prefix docker
  logstash_dateformat %Y_%m
  index_name docker_log
  flush_interval 5s
  type_name docker
  include_tag_key true
启动fluentd服务
systemctl start td-agent
启动容器
1.首先修改nginx的日志格式为json
log_format  main  \\'{"remote_addr": "$remote_addr", "remote_user": "$remote_user","time_local": "$time_local","request": "$request", \\'
                      \\'"status": "$status", "body_bytes_sent":"$body_bytes_sent","http_referer": "$http_referer" ,\\'
                      \\'"http_user_agent": "$http_user_agent", "http_x_forwarded_for":"$http_x_forwarded_for"}\\';
2.启动容器
使用docker内置的日志驱动把日志传出给fluentd
docker run -dit -p 8080:80\
             -v /test/nginx.conf:/etc/nginx/nginx.conf \
             --log-driver=fluentd \
             --log-opt fluentd-address=localhost:24224 \
             --log-opt tag="docker.{{.Name}}" \
             nginx
#测试docker访问正常
[root@test-node3 ~]# curl localhost:8080Welcome to nginx!
Welcome to nginx!
If you see this page, the nginx web server is successfully installed and
working. Further configuration is required.
For online documentation and support please refer to
nginx.org.
Commercial support is available at
nginx.com.
Thank you for using nginx.
安装kibana
下载kibana
wget https://artifacts.elastic.co/downloads/kibana/kibana-5.2.2-linux-x86_64.tar.gz
[root@salt-node1 src]# tar zxf kibana-5.2.2-linux-x86_64.tar.gz
[root@salt-node1 src]# mv kibana-5.2.2-linux-x86_64 /usr/local/kibana
[root@salt-node1 src]# cd /usr/local/kibana/
[root@salt-node1 kibana]# vim config/kibana.yml
server.host: "192.168.198.116"
elasticsearch.url: "http://localhost:9200"
启动kibana
[root@salt-node1 kibana]# ./bin/kibana
  log   [17:06:42.720] [info][status][plugin:kibana@5.2.2] Status changed from uninitialized to green - Ready
  log   [17:06:42.831] [info][status][plugin:elasticsearch@5.2.2] Status changed from uninitialized to yellow - Waiting for Elasticsearch
  log   [17:06:42.877] [info][status][plugin:console@5.2.2] Status changed from uninitialized to green - Ready
  log   [17:06:42.970] [info][status][plugin:elasticsearch@5.2.2] Status changed from yellow to green - Kibana index ready
  log   [17:06:43.551] [info][status][plugin:timelion@5.2.2] Status changed from uninitialized to green - Ready
  log   [17:06:43.559] [info][listening] Server running at http://192.168.198.116:5601
  log   [17:06:43.562] [info][status][ui settings] Status changed from uninitialized to green - Ready
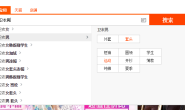
现在对web页面索引搜索进行配置
添加索引


现在你可以去看看你的日志了
- 查找发现
- 配置时间
- 配置最近15分钟的日志
- 开始搜索

现在大家可以开始通过kibana索搜日志了,但这个架构会出现一个问题,当es重启过程中会丢失部分日志,这时候我们就需要一个稳定的消息管理工具。这里我推荐大家使用kafka。
官网地址:http://kafka.apache.org/
本文出”自运维之我的历程”博客,请务必保留此出处http://nginxs.blog.51cto.com/4676810/1922519
转载请注明:拈花古佛 » 使用ELK处理docker日志